Understanding Stable Swap
What is CP-AMM and is there any room for improvement?
CP-AMM is the most widely used algorithm around DEXes, designed to move along the curve of xy = k (x, y: balance of each token in the liquidity pool, k: constant) when swapping between two tokens.
Without loss of generality, we can set asset y as stablecoin, which makes calculation of asset x’s price much easier:
p = - (dy / dx) = (y / x)
We can clearly see that the price of asset x is determined solely by the proportion between asset x and y in the liquidity pool.
Calculating the total value of asset x in dollars would get us:
px = y
This implies that total value of asset x is equivalent to the total value of asset y(regardless of their prices). This allows for CP-AMM to provide uniform liquidity across all price levels.
In this sense, CP-AMM can also be viewed as an order book trading system that contains nearly uniform amount of bid/ask orders for every price point(from 0 to infinity). This form of liquidity would be suitable for swaps between assets with high price volatility, but extremely inefficient for swaps between stablecoins. This is because whereas stablecoins are mostly likely stable around one dollar(with few exceptional cases☹️), CP-AMM wastes most of its liquidity on prices beyond the 1:1 price range. Moreover, the trader needs to take on higher slippage costs than is actually needed.
A Deep-dive into Stableswap Formula
Stableswap was first introduced by Michael Egorov, founder of Curve Finance through the whitepaper released in November 2019, tackling the exact problems of CP-AMM explained above. The basic idea is to provide concentrated liquidity around the 1:1 price range for higher capital efficiency and lower slippage cost. This requires a different swap curve from that of CP-AMM’s.
First, let’s imagine a liquidity pool that always swaps at a constant, one-dollar rate. The curve’s formula would be as follows:
x + y = D (x, y: number of each token in the liquidity pool, D: constant)
We can see from the formula that the price of asset x is always $1 (p = -(dy/dx) = 1).
As the sum of x and y is kept constant, we call this form of the curve a CS-AMM(Constant-sum Automated Market Maker).
CS-AMM guarantees a fixed rate of 1:1, but is problematic for pragmatic reasons. Stablecoins do have rare cases of price volatility and when that happens, the relatively safe stablecoins will all be withdrawn, making the pool useless with only the volatile stablecoins left.
With this in mind, Stableswap was designed to follow the CS-AMM curve around 1:1 price range, but asymptotically approaches the CP-AMM curve beyond that range.
Below formula is derived by multiplying χDto the CS-AMM formula and then adding CP-AMM formula(χ here implies how much we are closer to the CS-AMM formula, and D exists to match the dimension with CP-AMM formula):
χ D (x + y) + xy = χ D² + (D/2)²
If χ equals 0, our formula would be identical to the CP-AMM curve, and if χ diverges to infinity, our formula would be identical to the CS-AMM curve. Therefore, we need large χ around the equilibrium point and near-zero χ as we move away from the equilibrium.
To achieve these characteristics, Stableswap defines χ as following:
χ = Axy / (D/2)²
A is a constant for each liquidity pool, where larger A suggests getting closer to the CS-AMM curve around the equilibrium point. At the equilibrium of x = y = D/2, χ is at its maximum(=A), while χ approaches 0 when getting farther away from the equilibrium. Defining χ this way allows the curve to behave much like CS-AMM around the equilibrium, and much like CP-AMM away from it.
Substituting χ, we get the Stableswap formula:
4A(x+y) + D = 4AD + D³/(4xy)
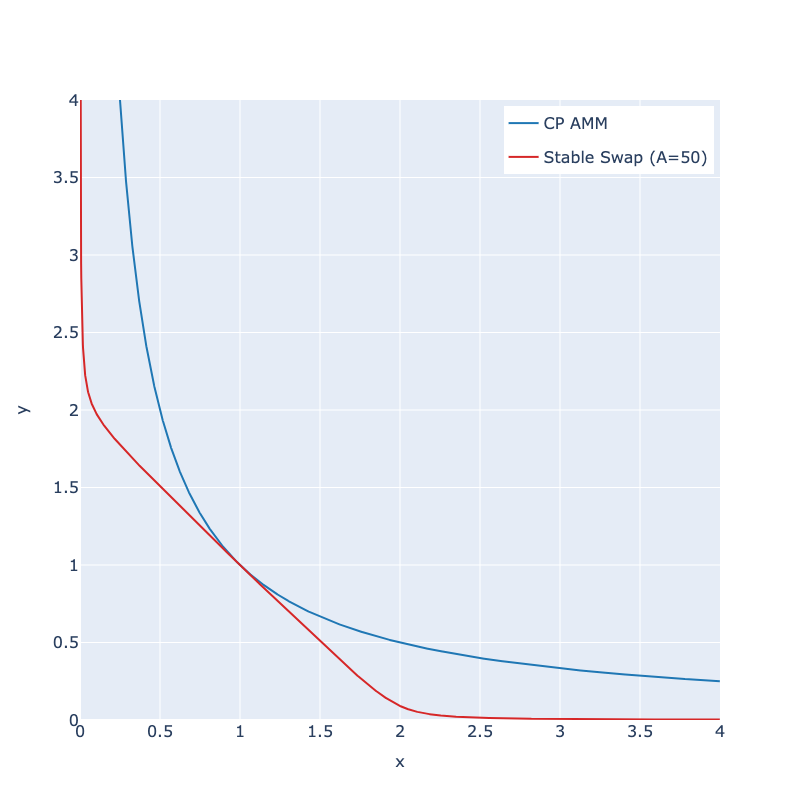
Comparing the Stableswap curve with that of CP-AMM:

Stableswap provides a flat region around the equilibrium, but also the shape of a CP-AMM beyond a certain region.
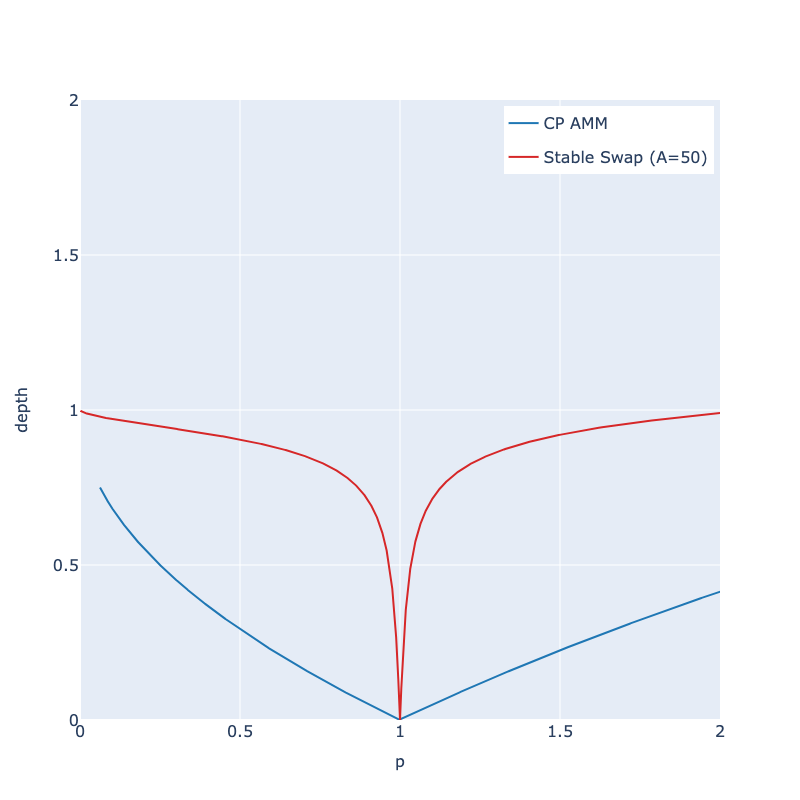
The below graph is a depth chart of asset x assuming asset y is a stablecoin for simplicity(We also assume the equilibrium price of asset x to be $1). “Depth” here represents the amount you can buy or sell(in USD) from $1 to a particular price point. It’s identical in meaning with the “depth chart” used in general order-book trading systems.

As evident in the above chart of A=50, Stableswap provides eminently higher depth around the center compared to CP-AMM. Numerically, Stableswap provides 46 times bigger liquidity at 1%-depth — the depth for 1% price change. Using 2,000 for A in fact guarantees 168 times bigger liquidity at 1% depth. (For a pair of non-volatile stablecoins, A is usually set to a number bigger than 2,000.)
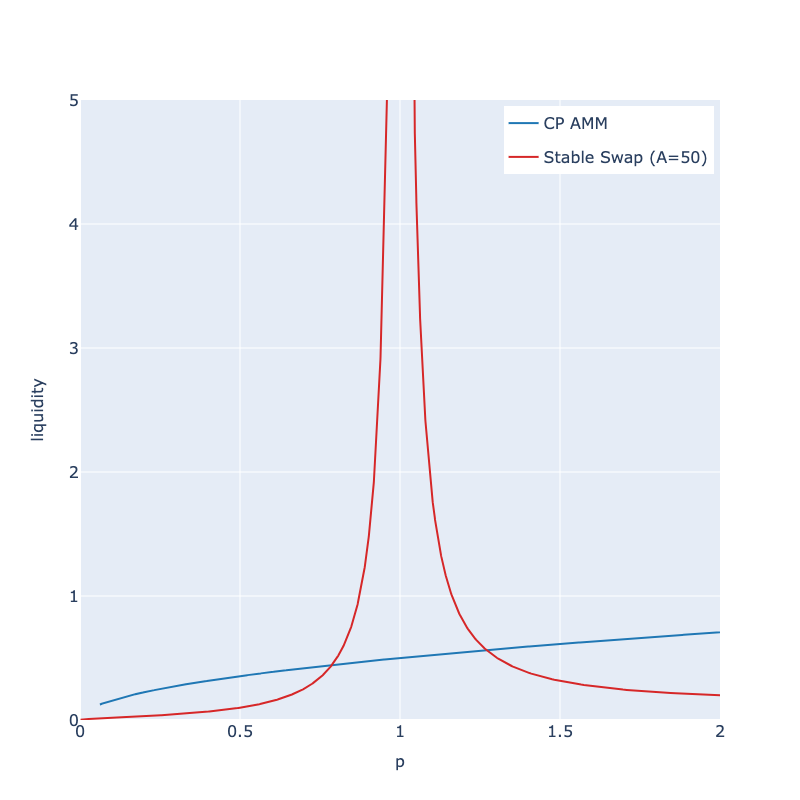
Following is the graph of dy / d(ln p) along with p. This quantity represents the thickness of bid/ask orders in a typical order-book trading system.

As can be seen from the above graph, Stableswap provides much thicker liquidity around the center, but much thinner ones beyond a certain point, compared to CP-AMM. Thicker liquidity is formed around -21% ~ +27% range centered around the equilibrium price with A=50. Changing A to 2000, the thicker liquidity is concentrated around the -6.3% ~ +6.7% range. Stablecoins rarely lose the dollar-peg beyond these ranges, we can safely conclude that Stableswap always provides much thicker liquidity than CP-AMMs.
Conclusion
We have demonstrated how Stableswap concentrates most of the liquidity around the 1:1 exchange rate region. Through such mechanism, Stableswap solved many of the problems intrinsic to CP-AMM stablecoin swaps. CP-AMM would typically cause high slippage cost even with small swap volume; whereas Stableswap can handle much bigger volumes even with smaller slippage costs. This would attract more users since they all want lower slippage costs, and liquidity providers will receive higher yields also.
Curve Finance is now the biggest DEX around stablecoins, owing much of it to the Stableswap algorithm.
Moreover, Stableswap can be generalized beyond stablecoins, such as 1:n pegged asset pairs or “wide-sense” 1:1 asset pairs such as KLAY-AKLAY pair, where exchange rates are safely bounded around the 1:1 region.
Last updated